Hawaii is entering the fall 2026 travel season with a tourism market that looks stronger on the surface than it does underneath. Visitor arrivals are still growing, spending remains above last year’s levels, and domestic travelers continue to provide a substantial base of demand. Yet the average trip is getting shorter, international markets are weakening, severe weather has disrupted travel, and higher costs are changing where visitors spend their money once they arrive.
The latest figures from Hawaii’s Department of Business, Economic Development & Tourism (DBEDT) show the shift clearly. In July 2026, Hawaii welcomed 883,248 visitors, an increase of 1.1% from July 2025. Total visitor spending reached $1.99 billion, up 1.7%. But average length of stay fell from 8.83 days to 7.59 days, a 14.1% decline. Total visitor days dropped 13.1%. At the same time, average daily spending jumped 17.1% to approximately $296 per person.
That combination is becoming the defining feature of Hawaii’s fall travel market: more money being spent per day, but fewer days being spent in the islands.
Hawaii Is Still Attracting Visitors, But They Are Staying Less Time
The most important distinction in Hawaii’s 2026 tourism story is the difference between visitor arrivals and visitor days.
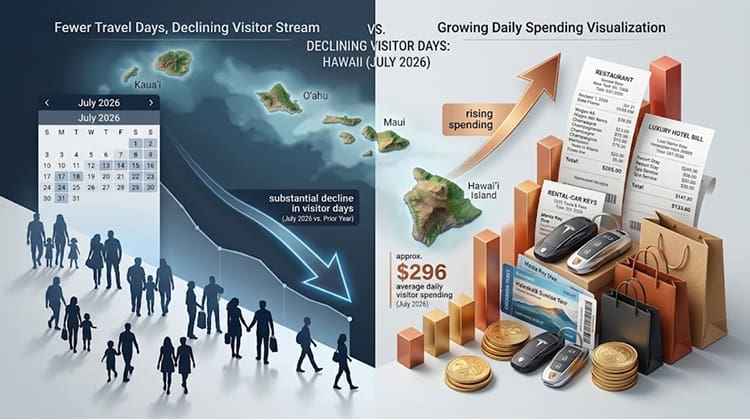
A destination can welcome roughly the same number of people while experiencing a meaningful reduction in tourism activity if those visitors leave sooner. That is exactly what has happened in Hawaii. June produced 858,577 visitors, almost unchanged from the previous year, but the average stay fell from 8.86 days to 7.86 days. Statewide visitor days declined 11.2%.
July intensified the pattern. Arrivals increased 1.1%, yet the average stay dropped to 7.59 days. The result was a 13.1% reduction in the average daily visitor census compared with July 2025. In practical terms, Hawaii had more people arriving during the month but considerably fewer visitors physically present on a typical day.
This matters because tourism spending is distributed across more than hotels and airlines. Restaurants, rental-car companies, retailers, tour operators, attractions and smaller businesses depend heavily on visitors remaining in a destination long enough to make multiple purchases.
Recent reporting from Hawaii tourism officials and local businesses shows how this shift is being felt. The state is generating higher daily visitor spending, but businesses in places such as Waikīkī are seeing the consequences of shorter stays and tighter visitor budgets.
The fall season therefore begins with a different question than simply whether Hawaii will be busy. The more relevant question is how much activity each visitor will generate before leaving.
Higher Daily Spending Is Masking A Decline In Visitor Days
Hawaii’s numbers would look considerably weaker without the increase in spending per visitor.
In July, visitors spent an average of approximately $296 per person per day, compared with $253 a year earlier. That was a 17.1% increase. Total visitor expenditures still reached $1.99 billion despite the sharp reduction in visitor days.
At first glance, this could suggest that Hawaii is successfully moving toward a higher-value tourism model. The state’s tourism strategy has explicitly focused on increasing visitor spending while managing the pressures created by additional visitor volume. The Hawaii Tourism Authority’s proposed 2026–2030 strategic plan identifies higher average daily visitor spending and increased shoulder-season spending as important performance measures.
But there is an important distinction between travelers spending more because they are choosing premium experiences and travelers spending more because prices have increased.
Recent analysis from Honolulu-based reporting has highlighted that inflation is an important factor behind the higher daily spending figures. Hawaii’s July 2026 consumer price index was 5.6% higher than a year earlier, while transportation prices were up 6.4% and housing costs were up 6.1%.
That makes the fall outlook more complicated. A visitor spending $296 per day does not necessarily generate the same economic benefit as a visitor voluntarily adding another two or three days to a vacation. A shorter trip can mean fewer restaurant meals, fewer excursions, fewer shopping trips and fewer visits to attractions even if the daily bill is higher.
The difference is particularly important for businesses located away from the major hotel corridors.
Oahu Is Showing The Pressure In A Different Way
Oʻahu remains Hawaii’s largest visitor market, but its 2026 numbers show why statewide averages can hide important differences between islands.
In July, Oʻahu received 499,197 visitors, down 3.7% from July 2025. Visitor spending, however, increased 2.8% to $885.3 million. The island’s average daily visitor census fell 12.0% to 104,091.
The first seven months tell a slightly different story. Oʻahu received 3.39 million visitors, almost identical to the previous year’s total, while visitor spending increased 5.9% to $6.04 billion.
That creates an unusual environment for Honolulu and Waikīkī. Hotels can still have strong occupancy while surrounding businesses experience weaker foot traffic because travelers are compressing their itineraries.
July hotel data illustrates the point. Statewide hotel occupancy reached 81.8%, while Oʻahu reached 87.8%. Waikīkī reached 88.5%. Statewide RevPAR was approximately $325, up 9.9% year over year. Oʻahu’s RevPAR reached $270, while Waikīkī reached $256.
The hotel market therefore does not look like a conventional tourism collapse. Hotels are still selling rooms. The issue is what happens around those rooms after guests check in.
For travelers planning fall trips, that could make Honolulu particularly interesting because a high hotel occupancy rate does not necessarily mean every part of the visitor economy is experiencing the same level of demand.
Maui Is Recovering, But Its Tourism Economy Remains Different
Maui is showing stronger visitor growth than Oʻahu in several of the latest measures.
In July 2026, Maui received 247,857 visitors, an increase of 5.6% from July 2025. Visitor spending reached $539.9 million, up 5.7%. Yet the island’s average daily visitor census was still 10.6% below the previous year.

The first seven months were stronger. Maui welcomed 1.62 million visitors, up 7.7%, while visitor spending rose 11.3% to $3.88 billion.
Hotel performance has also improved. July Maui County occupancy was 73.7%, up 7 percentage points, while ADR reached $579 and RevPAR climbed to $426.
That recovery is significant given Maui’s tourism disruption following the August 2023 wildfires. Yet the island still faces the same broader problem affecting Hawaii: more arrivals do not automatically translate into more visitor days.
The fall season may therefore be especially important for Maui businesses that rely on longer stays. A visitor who spends five or six days on Maui can generate substantially more local economic activity than one who compresses the same itinerary into three or four days.
International Travel Is Becoming A Bigger Problem For Fall
Domestic travelers are currently carrying much of Hawaii’s tourism demand, particularly visitors from the U.S. West and U.S. East.
During the first half of 2026, arrivals from the U.S. East increased 13.4%, while spending from that market increased 15.0%. U.S. West arrivals rose 1.0%, with spending increasing 7.6%.
The international picture is considerably weaker.
Scheduled nonstop air seats between September and November 2026 show a 12.9% decline for Japan, a 12.7% decline for Canada, a 21.8% decline for South Korea and a 21.3% decline for Oceania. At the same time, U.S. West capacity is scheduled to increase 6.5%, with U.S. East capacity up 4.4%.
That shift matters because Hawaii has historically relied on international travelers as an important part of its visitor mix. Recent reporting indicates that Japanese visitation remains dramatically below pre-pandemic levels, while Canadian travel has also weakened.
The fall 2026 market is consequently becoming more dependent on travelers who can reach Hawaii from the continental United States.
That changes the competitive environment. Domestic travelers can compare Hawaii with California, Mexico, Florida, Arizona and other destinations without committing to an international itinerary. When airfare and hotel prices remain elevated, the decision to spend a week in Hawaii becomes more sensitive to the total trip cost.
Weather Is Adding Another Layer Of Uncertainty
The tourism slowdown is also arriving during an unusually active period of Pacific weather.
Hurricane Lowell approached Hawaii in early September, passing west of Niʻihau on September 7. The National Weather Service recorded maximum wind gusts of 84 mph at Līhuʻe Airport and 85 mph in Waimea, with a 92 mph gust recorded at Puu Lua.
Hurricane Nolo then created another period of disruption later in September. The Hawaii Tourism Authority issued multiple visitor updates as the storm moved near the islands, while the National Weather Service warned of additional rain bands and hazardous surf.
Kauaʻi has been particularly relevant to the fall travel picture. As of September 23, most accommodations, restaurants, shops, tours and activities had reopened following Hurricane Lowell, although some areas and parks remained restricted.
For travelers considering Hawaii during the remainder of hurricane season, flexibility is becoming a more important part of trip planning. The issue is not that Hawaii is closed for fall travel. Most tourism infrastructure remains operational. The issue is that weather can temporarily affect roads, trails, flights, beaches and outdoor activities.
That makes travel insurance, flexible reservations and checking official island updates closer to departure more relevant than they might be during a more stable period.
Hawaii’s 2026 Forecast Shows A Smaller Tourism Footprint
The state’s September economic forecast provides the clearest indication of where the market is heading.
DBEDT projects approximately 9.7 million visitor arrivals in 2026, an increase of 0.9%. But visitor days are forecast to decline 4.5%, while nominal visitor expenditures are expected to increase 2.3% to approximately $22.4 billion.
| Hawaii Tourism Indicator | 2026 Forecast |
|---|---|
| Visitor Arrivals | 9.7 million |
| Visitor Arrivals Growth | +0.9% |
| Visitor Days | -4.5% |
| Visitor Expenditures | $22.4 billion |
| Visitor Expenditures Growth | +2.3% |
This is perhaps the most useful framework for understanding Hawaii’s fall travel market.
The state is not forecasting a collapse in arrivals. Instead, it expects a tourism economy that produces more spending from fewer total visitor days.
That distinction also explains why Hawaii’s tourism strategy is increasingly focused on shoulder seasons, daily spending and destination management rather than simply maximizing the number of arrivals.
For travelers, this can create opportunities. Fall is already outside Hawaii’s busiest summer travel window, and the combination of shorter stays and uneven demand may create more variation in prices between islands, hotels and dates.
Fall Travelers Are Getting More Reasons To Compare Islands
The biggest practical consequence of Hawaii’s changing tourism market is that the four major visitor islands are increasingly behaving differently.
Oʻahu offers the largest urban tourism ecosystem and strong hotel occupancy, with Honolulu providing restaurants, beaches, shopping, cultural attractions and extensive visitor infrastructure.
Maui is showing strong recovery in both arrivals and spending, but visitor density remains below last year’s level. Its hotel market also commands substantially higher rates than Oʻahu.
Kauaʻi is dealing with post-storm recovery while continuing to welcome visitors. Travelers choosing the island should check current access information rather than assuming every trail, road or attraction has returned to normal.
Hawaiʻi Island offers another distinct profile, with July visitor arrivals essentially flat but visitor spending down 2.9% year over year. Its average daily visitor census was 15.1% lower.
For travelers comparing options, this means the traditional question of which Hawaiian island is “best” is less useful than asking what type of fall trip fits the current conditions.
A traveler looking for a shorter urban vacation may find Oʻahu easier to organize. Someone prioritizing resort time may look at Maui. A traveler interested in nature should check current conditions on Kauaʻi and Hawaiʻi Island before locking in outdoor-heavy plans.
This more flexible approach mirrors the broader shift in Hawaii tourism: the destination is still attracting visitors, but the structure of each trip is changing.
The Fall 2026 Hawaii Trip Is Becoming More Intentional
Hawaii’s tourism market is entering fall with a strange combination of resilience and pressure.
The state expects visitor arrivals to grow in 2026. Spending is also expected to increase. Hotel performance remains substantial, and domestic air capacity is supporting demand. But visitor days are falling, international air capacity is weaker in several major markets, inflation remains elevated and severe weather has added another layer of uncertainty.
For travelers, the result is a market where the length and structure of a trip matter more than simply choosing Hawaii as a destination.
The current data also fits the broader pattern seen across the U.S. travel market, where travelers continue to spend but increasingly evaluate value, trip length and destination costs. For context, the changing U.S. hotel environment is also influencing how travelers compare destinations, as shown in U.S. hotel rate trends.
Hawaii’s own numbers suggest that fall 2026 will be less about a simple tourism boom or bust and more about how efficiently the islands convert each visitor into local economic activity.
That distinction could become increasingly important as Hawaii heads into 2027. If arrivals continue growing while visitor days remain below previous levels, hotels may continue to perform reasonably well while restaurants, retailers, tour companies and smaller tourism businesses compete for a smaller number of daily visitor interactions.
For travelers, that creates a different kind of Hawaii vacation: shorter, more carefully planned and increasingly sensitive to island-specific conditions, airfare capacity and the total cost of staying in paradise.